Comparing Political Parties on the Spectrum
With the data gathered from our political spectrum quiz, we decided to show you where different demographic groups scored via our comparison tool. However, because this only shows the average, it is somewhat limited.
Wouldn't it be more interesting to see how different groups spread their scores across the grid? Of course! We thought it would be most interesting to see how the US political parties fared on our quiz. The images below represent a random sampling of actual scores by party affiliation. Caveats to consider include that this is not a scientific survey and relies on self-selection.
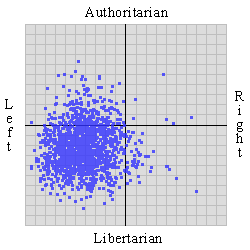
Democrats
Each blue dot you see is an actual data point from our quiz representing the score of
someone who identified as a Democrat. You can see Democrats are rather concentrated in the
lower left quadrant (left-libertarian), with some spill-over into the authoritarian side.
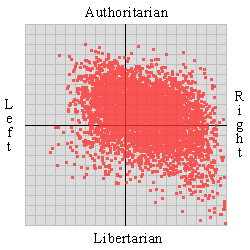
Republicans
The red dots are data points from our quiz representing the score of
someone who identified as a Republican. Interestingly, Republicans show a wider spread of
results than Democrats. They lean authoritarian, though move further libertarian as they
go rightward.
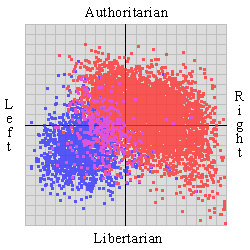
Democrats and Republicans
This grid shows both Democrats and Republicans, highlighting where they overlap. Blue
for Democrats, red for Republicans.
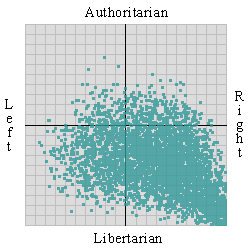
Libertarians
The dots on this grid represent Libertarian scores. The majority fall along a line that
stretches from the center to the lower-right quadrant (right-libertarian).
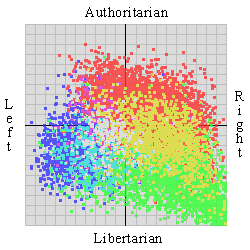
Democrats, Republicans and Libertarians
Because libertarianism is popular on the web, we decided to overlay it with the two major
political parties. Here you see all three, with green this time representing the Libertarians.
Yellow is where Republicans and Libertarians overlap, white is where they all overlap.
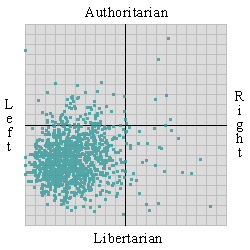
Green Party
The dots here represent the Green Party, which is not too different from the Democrats' results,
but a bit further to the left.
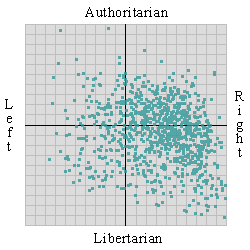
Constitution Party
The dots here represent the Constitution Party, which is pretty center-right. We did not
have as many data points for this party as for the others.
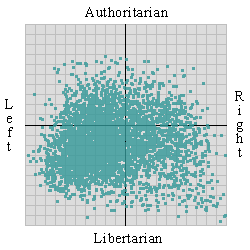
Independents
Finally, this is a grid representing the scores of Americans who identified as independent.
As expected the results are all over. But there is a concentration toward left-libertarian relative
to the center.